

17 Sep JEPI Stock Price And Analysis
JEPI Stock Price and Analysis
By September 2023, the JEPI ETF stock, JPMorgan Equity Premium Income ETF (JEPI) has made a significant mark in the US actively managed ETF market, boasting more than $29 billion in assets.
Investors are attracted to JEPI due to its impressive performance in 2022 and its appealing portfolio characteristics, which include stable, dividend-paying blue-chip stocks, low volatility, substantial annual returns, and the potential for monthly income.
The JPMorgan Equity Premium Income ETF (JEPI) presents an attractive choice for those looking for income and exposure to the stock market while minimizing volatility. The fund seeks to provide monthly income through a carefully designed investment approach.
ETF Overview
- Category Derivative Income
- Fund Family JPMorgan
- Net Assets 34.38B
- YTD Daily Total Return 11.35%
- Yield 7.19%
Sector Weightings
- Technology: 19.65%
- Healthcare: 15.48%
- Industrials: 13.42%
- Financial Services: 11.73%
- Consumer Defensive: 10.27%
- Consumer Cyclical: 10.10%
- Utilities: 5.50%
- Communication Services: 4.91%
- Energy: 3.62%
- Real Estate: 3.01%
- Basic Materials: 2.32%
A dividend ETF with an 11.77% yield: Is It Possible?
JEPI stock JPMorgan Equity Premium Income ETF pays monthly dividends to its shareholders. It displays an average annual yield of 11.77%! In other words, over 2022, its performance has largely exceeded American stocks of around 1.70% yield. It has also been superior to REITs and American high-yield bonds, which offer around 9% yield.
With €51,000 invested, you could pay yourself an additional income of €500 per month thanks to this dividend ETF and its 11.77% yield. You would have even obtained a slightly better performance than the market since its creation in mid-2020, with 12.03% annualised dividends reinvested against 12.01% for the S&P 500. Similarly, with volatility and a maximum loss lower than the market (-13% against -24% for the S&P 500), you would have achieved better results
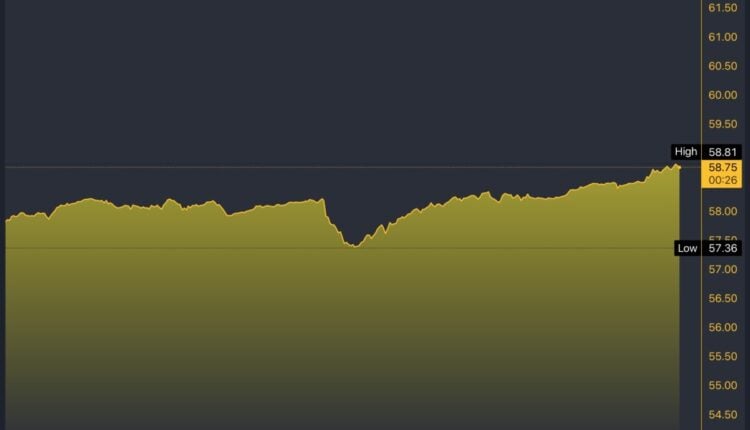
JEPI Stock Chart
JEPI Portfolio
The JEPI portfolio employs a cautious equity selection strategy, utilising a detailed bottom-up research methodology to identify stocks based on unique risk-adjusted rankings. Additionally, the fund utilises a systematic options overlay that involves writing out-of-the-money call options on the S&P 500 Index, generating monthly income while preserving equity exposure.
JEPI has delivered a compelling 12-month rolling dividend yield of 7.55% and a 30-day SEC yield of 6.88%. These yields rank in the top half of the Derivative Income category, highlighting JEPI’s ability to deliver consistent income. The fund has a low expense ratio of 0.35%, making it a cost-effective choice compared to similar options.
JEPI Stock Price Today – Trading Data
JEPI’s trading data shows that the fund opened at $58.68, with a day low of $58.85 and a day high of $58.85. The fund’s 52-week low is $48.32, and its 52-week high is $58.66. This shows stable performance over the past year. Furthermore, JEPI’s assets under management (AUM) total $34.85 billion, with 597.6 million shares outstanding. The fund’s average monthly trading volume is 3.27 million, reflecting active investor interest.
JEPI has $34.38 billion in net assets and a year-to-date return of 11.35%. It offers a 7.19% yield, with top holdings in diverse sectors like technology and healthcare, aiding in risk management for income-focused investors.
The average JEPI stock forecast price target is $63.42, with a high forecast of $71.52 and a low forecast of $52.00. The average price target represents an 8.32% change from the last price of $58.53.
JEPI Stock Alternatives
Compared to alternative ETFs in the FactSet Equity: US – Large Cap Segment, JEPI holds its own. Although cheaper ETFs like BKLC offer a 0.00% expense ratio, JEPI’s expense ratio of 0.35% is still competitive. SPY, the largest ETF by AUM, has an expense ratio of 0.09% and a year-to-date return of 18.22%, but JEPI’s focus on income generation makes it stand out.
Strategy Behind the Monthly Dividend ETF
The JEPI stock ETF comprises 80% to 85% of large American companies with a yield of around 2%. The remaining 15% to 20% of the portfolio is used for an options strategy. More precisely, these are ELNS, Equity-Linked Notes, and a more advanced version of covered call options.
In reality, if 80% of the portfolio only delivers a 2% yield, to obtain 12% in total, the last 20% must deliver a 52% yield. This high yield comes at a price: that of the risk of ELNs.
JEPI Stock: Buy or Sell
JEPI offers a compelling option for investors seeking a balance of income and market exposure with reduced volatility. Its strong performance, diverse portfolio, and focus on monthly dividends make it an appealing choice for income-focused investors looking for consistent returns.
The post JEPI Stock Price And Analysis appeared first on FinanceBrokerage.
Sorry, the comment form is closed at this time.